Value Capture from Metro Expansion in Santiago
Does new transit infrastructure translate into local government revenue?
Overview
Chile invested more than USD 1,500 million in Metro Line 3 alone, part of a broader recent expansion that also includes Line 6 and the Line 2 extension. This thesis follows the full chain from that investment to municipal budgets: does the Metro create measurable urban value near its new stations, and if so, how much of that value actually reaches local government finances?
The answer is a story of disconnect. The market can recognize and price accessibility — most clearly along Line 3. But turning that value into municipal revenue depends on a fiscal system with several filters in between: how the tax authority (SII) assesses land, which properties are exempt, and how revenue is redistributed nationally before it reaches a municipality’s own budget.
Research Question
How much of the urban value created by transit infrastructure expansion is captured by local government finances, and through which fiscal channels — property taxes or business licenses?
Data & Empirical Strategy
The analysis covers three corridors of recent Metro expansion — Line 3, Line 6, and the Line 2 extension — chosen because they span very different urban contexts (consolidated, pericentral, and southern-periphery communes) and very different fiscal profiles under Chile’s Fondo Común Municipal (FCM), the mechanism that redistributes property tax revenue nationally. Providencia, for instance, self-finances most of its budget through property tax and receives little FCM support; El Bosque depends heavily on the FCM and collects comparatively little property tax of its own. Both are exposed to the Metro, but with very different fiscal capacity to keep any value it creates.
The panel combines the SII property cadastre (assessed values, tax base, exemptions), actual sale-price transactions (Form 2890), SII commercial registry and SINIM business-license data, and CGR-SUBDERE municipal budget data — built at the property level and aggregated to the commune where relevant.
Identification: difference-in-differences within each corridor. Treated properties sit within 500m of a new station; controls sit 1,000–4,000m away in the same corridor (with a buffer zone excluded in between). The dependent variable is the log price per square meter, and the temporal cutoff is the start of construction (or the inauguration for Line 6, since construction fell outside the data window). The resulting coefficient measures a local effect within each corridor — not an aggregate effect of the Metro on the whole commune.
Key Findings
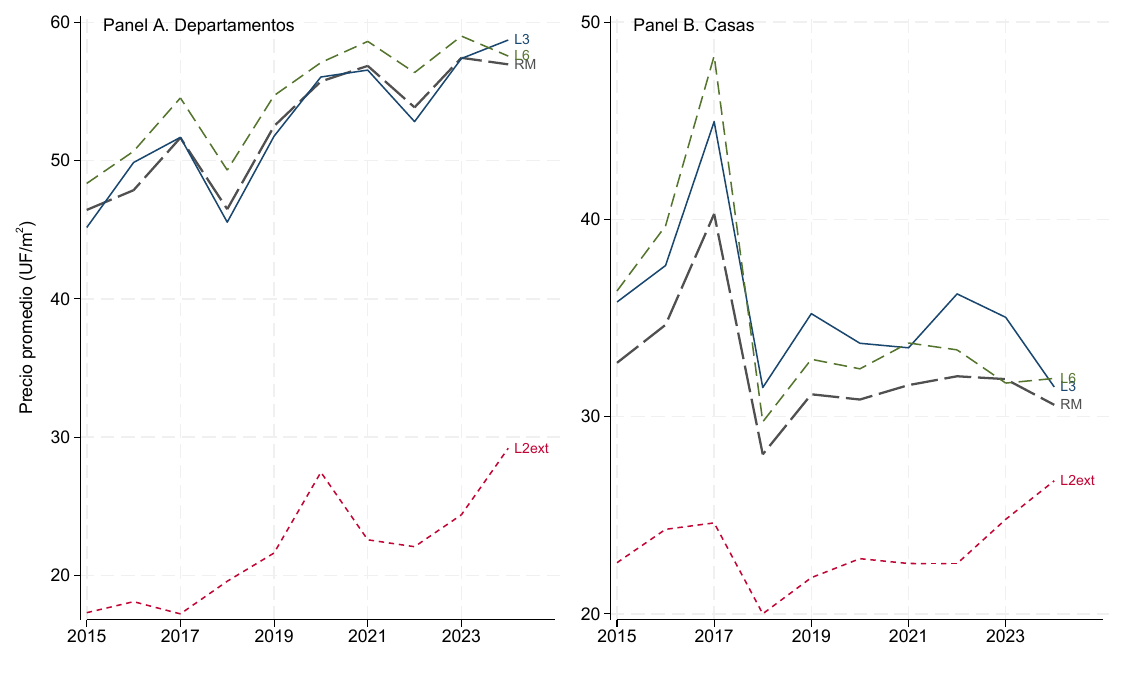
1. Residential capitalization exists, but it’s concentrated, not automatic. Under the preferred specification, properties near new Line 3 stations command a 6.7% price premium over otherwise-comparable properties further away — driven more by apartments than houses. Line 6 and the Line 2 extension show no robust average premium, which doesn’t mean the Metro destroys value there; it means capitalization depends on the local market, not just on proximity to a station.
2. That value doesn’t automatically reach the property tax roll. The fiscal land value used for taxation (the VUT) does get updated between 2018 and 2022 — but not differentially more near stations than in comparable zones. This is consistent with how VUT is set: by broad homogeneous zones, not property by property, so it can miss highly localized gains. Even where value is captured by the market, a large share of nearby housing stock is tax-exempt or under-assessed, and a significant part of what is collected gets redistributed elsewhere via the FCM.
3. The commercial channel is real, but nodal and uneven. Business openings (from SII registry data) cluster near some stations, especially on Line 3 and Line 6 — mostly everyday services responding to new foot traffic, not a few large anchor businesses. At the commune level, this shows up in business-license (patente) revenue in specific places (La Reina on Line 3, San Joaquín on Line 6) but not uniformly across all exposed communes. This evidence is descriptive, not causal.
Data Pipeline & Reproducibility
The empirical work runs on a single canonical Stata pipeline (00_master.do) rather than a stack of one-off scripts: a 10_build stage assembles the residential, commercial, and municipal-fiscal panels; a 20_analysis stage runs each empirical question as its own module — residential market capitalization, residential and non-residential property capture, commercial activity, municipal business licenses, and final FCM fiscal retention — in that order; and a 30_robustez stage holds alternative specifications and checks. Every figure and table in the thesis traces back to a specific, named script in that pipeline.
Policy Implications
Evaluating transit infrastructure from a municipal-finance lens requires looking at the instruments, not just at prices. Improving accessibility isn’t enough if fiscal appraisal, the taxable base, and FCM redistribution absorb most of the gain before it reaches a municipality. For local governments, the more responsive margin looks commercial — zoning and conditions that support local economic activity — but even there, the benefits are nodal and unevenly distributed. The real policy question isn’t only how much value infrastructure creates, but which rules let part of that value stay in the territory that generated it.
Citation
@mastersthesis{medrano2026metro,
  title={Value Capture from Metro Expansion in Santiago: From Residential Prices to Municipal Finances},
  author={Medrano, Maykol},
  year={2026},
  school={Instituto de Economía, Pontificia Universidad Católica de Chile},
  type={Master's Thesis}
}